Due to the sophisticated features and internet connectivity required across diverse industries, today’s products typically necessitate the integration of computing platforms that are collectively referred to as embedded systems. In general, embedded systems encompass processors, supporting circuitry and internal software. The collaboration of these components creates features necessary for successful products in today’s competitive markets.
Firmware is the internal software within a product. Throughout the decades, peering into the firmware has been expensive, time-consuming and problematic. Consequently, these qualities tend to transform firmware bugs into considerable risks resulting in missed market opportunities, product instability and cost overruns.
As the complexity of firmware rapidly escalates, it is imperative the developer’s toolkit continues to evolve to meet the challenges of analyzing today’s complicated firmware.
This blog post focuses on debug probes targeting cores (ARM, Xtensa, MIPS, etc.) utilized in many of today’s most popular systems-on-a-chip (SoCs).
Contents
What Are Debug Probes?
The foundation of the firmware developer’s toolkit is the debug probe, which provides a bridge from the target device to the host development system. Over the years, the debug probe has matured from a proprietary, temperamental interface into an open, robust interface capable of deep analysis of critical firmware issues. Debug probes include the following components:
- probe hardware (dongle)
- probe firmware
- target device bus
- development host interface
The evolution of commodity hardware components and open-source software continues to strengthen the efficiency of firmware development. To that end, probes enable reading and writing registers and memory, source-level debugging, execution tracing, breakpoints, etc.
Probe Hardware (Dongle)
The probe (or dongle) is the physical hardware that interconnects the target device to the host system. This hardware may be internal to the board, external to the board or internal to the SoC. External probe hardware is available through commercial companies (Segger, for example) and open source projects (build your own or for purchase).
In the case of development boards, the probe hardware is typically internal and only requires a suitable interface cable to connect to the host development system. For production boards, probe hardware is generally excluded and an external probe is required for debug connectivity.
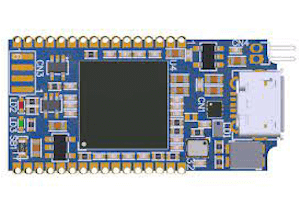
The hardware required for the probe is minimal and generally includes a microcontroller (MCU), its supporting components (connectors, LEDs, buttons, power regulators, etc.) and occasionally a USB-to-UART bridge. The following are examples of probes and their integrated MCUs:
- STM32 development boards (ST-Link internal probe) – STM32F103CBT6
- Black Magic Probe (external probe) – STM32F103CBUx
- OpenSDA Probe (external probe, internal probe) – K20DX128Vxx5
- MCU-Link Probe (external probe, internal probe) – NXP LPC55S69
- Segger J-Link (external probe, internal probe)
Each debug probe is supported by a variety of firmware images.
ST-Link Probe
Many of the STM Eval, Nucleo and Discovery development boards include version ST-LINK/V2-1 of the ST-Link probe. Mass storage and virtual COM port USB interfaces are important features of the ST-LINK/V2 probe version. The firmware in this probe supports a comprehensive suite of STM32 development tools, such as debuggers, programmers, performance monitors, etc. STLINK-V3SET is the next-generation external probe.
Black Magic Probe
The Black Magic Probe’s focus is the ARM Cortex-M and Cortex-A. Hardware schematics and firmware are publicly available from this open-source project. Due to the project’s open nature, probe hardware may be obtained from a variety of sources.
OpenSDA Probe
OpenSDA (Serial and Debug Adapter) is an open standard debug probe. The OpenSDA MCU executes the OpenSDA application, which includes firmware such as flash programmers, run-control debug interfaces, serial-to-USB converters, etc. Many of the NXP Kinetis (Freescale) and i.MX development boards are supported by the OpenSDA probe.
MCU-Link Debug Probe
NXP and Embedded Artists developed the MCU-Link Debug Probe. This probe supports many NXP device series, including i.MX, K6x, K2x, KE, LPC, etc. While the probe is compatible with devices supported by the LPC-Link2 probe, there are still scenarios in which the LPC-Link2 is the recommended probe.
Segger J-Link Probe
Segger manufactures several versions of the J-Link probe that differ in features and host interfaces supported. A wide range of device architectures is supported. J-Link probes seamlessly support Segger’s collection of firmware development tools.
Probe Firmware
The MCU embedded in the probe hardware requires firmware that implements the interface (or protocol) necessary for the host development tools to access and control the target device. Host tools such as pyOCD, OpenOCD, J-Link, etc. are supported by different versions of probe firmware. Probe firmware is available from a wide range of companies and open-source projects — for example:
- Black Magic firmware – BlackMagic-debug open-source project
- DAPLink firmware – Arm Mbed DAPLink open source project
- J-Link OpenSDA firmware – Segger
- OpenSDA firmware – PEmicro
Black Magic Firmware
For a complete open-source experience, the Black Magic probe firmware and hardware are paired together. The Black Magic firmware also supports several probe platforms, such as STLINK-V2, STM32 Blue Pill, HydraBus, STM32F4 Discovery and PC-hosted.
DAPLink Firmware
DAPLink firmware is open source and is a product of the ARM Mbed community. Interfaces supporting drag-and-drop programming and debugging are provided. This firmware implements the CMSIS-DAP (Cortex Microcontroller Software Interface Standard) protocol utilized to access ARM’s CoreSight Debug Access Port, providing a standardized interface for debuggers.
OpenSDA Firmware
Both OpenSDA and OpenSDAv2 firmware rely on the open hardware design of the OpenSDA debug probe. In OpenSDA firmware, the boot-loader and application are proprietary and owned by PEmicro. However, OpenSDAv2 firmware is developed by the open-source community. Segger offers OpenSDA / OpenSDAv2 firmware, which makes the OpenSDA platform compatible with its J-Link LITE.
Target Device Bus
Electrical buses most commonly utilized for connecting to target devices are JTAG (Joint Test Action Group) and SWD (Single or Serial Wire Debug). SWD overlays JTAG pins, and despite its name, requires two pins for its SWDIO (data) and SWCLK (clock) signals. Due to pin count restraints on complex SoC platforms, the SWD interface is more prevalent in those scenarios.
Serial Wire Output (SWO) compliments SWD through its single-trace pin, which is used to stream data from the target to the probe. This supports firmware trace and log tools on the host development system.
Development Host Interface
Powerful development tools, such as source-level debuggers, trace utilities and loggers, communicate with the probe through standardized interfaces like USB (common) and Ethernet (less common).
In many cases, the SoC includes USB and therefore does not require additional circuitry for communicating with the probe. Resource-constrained SoC platforms more typically support the UART interface and do not directly support USB. For these scenarios, the probe contains a USB-to-UART bridge (for example, Silicon Labs’ CP210x or FTDI FT231X) to support the USB host interface.
For remote access to the probe, one approach is to couple the probe with a Raspberry Pi. In this configuration, the Raspberry Pi serves as an Ethernet bridge to the probe’s USB interface.
Conclusion
With the variety of probe technology available, it can be overwhelming identifying the probe that best suits your project’s requirements. There are many aspects to consider, including price, support, host tool compatibility, target device support, etc. Requirements for projects are unique and impact the priorities of these aspects. If you need help narrowing in on the right debug probe for your project, let us know! We’ve successfully completed hundreds of embedded engineering projects and launched more than 200 commercialized products.