If you’re curious whether you have COVID-19, you might think that you can walk into a healthcare clinic, get tested and receive a binary yes/no answer. If the test used is perfect, it will always return “yes” if you have the disease and “no” if you don’t. But unfortunately, disease testing isn’t perfect.
Tests can fail by returning “yes” when you don’t have the disease (a false positive) and by returning “no” when in fact you do (a false negative). To make matters worse, the probability of these two errors might be different. As a result, you cannot conclude with certainty that your test has revealed your true condition. Given a positive test result, the best that can be done is to compute a probability that you have the disease. And perhaps unintuitively, this probability depends on the prevalence of the disease in your population.
This post shows two things: first, how a disease’s prevalence can be estimated using imperfect disease testing; and second, how the aforementioned probability depends on the prevalence. Some knowledge of conditional probability will make the following easier to follow.
Contents
1. Characterizing a Disease Test
We assume the test is characterized by two numbers, its sensitivity and its specificity. Both numbers are conditional probabilities intrinsic to the test.
- Sensitivity: This is the probability the test returns “yes” for a subject known to have the disease. Obviously, we’d like the sensitivity to be 1.
- Specificity: This is the probability the test returns “no” for a subject known to not have the disease. We’d like the specificity to be 1 as well.
In practice, neither of these numbers will be 1, which is why both false positives and false negatives occur.
With respect to notation, we’ll let P( ) denote probability, T denote a test result and I denote a subject’s infection state (technically, T and I are random variables). The Sensitivity, a, is the probability
a=P(T=y|I=y)
In words, read this equation as follows: “the sensitivity is the probability that the test result is ‘yes’ given that the infection state is ‘yes.'” Similarly, the specificity, b, is the probability
b=P(T=n|I=n)
In words, “the specificity is the probability that the test result is ‘no’ given that the infection state is ‘no.'”
We’ll need one more quantity, r, the disease prevalence. The prevalence is also a probability, namely, the probability that a person chosen at random from the target population has the disease. As an equation,
r=P(I=y)
The rules of conditional probability allow us to write the following relationship for the probability that a disease testing result will be “yes”:
P(T=y)=P(T=y|I=y)P(I=y)+P(T=y|I=n)P(I=n)
=ar+(1-b)(1-r)
Here, we’ve made use of the fact that probabilities sum to 1. As an example, if two outcomes are possible, and one has probability b, then the other must have probability 1 – b.
The test’s intrinsic parameters (a and b) are assumed known. Fortunately, we can easily estimate P(T = y) by randomly selecting people from the population, administering the test and seeing what percentage tests positive. Once we have this estimate, we can use it to estimate the disease’s prevalence by solving the above equation for r
r=\dfrac{P(T=y)+b-1}{a+b-1}
Finally, we can answer the question we really care about: what is P(I = y T = y)? In words, “what is the probability the infection state is ‘yes’ given the test result is ‘yes'”? Once again, using the laws of probability (in this case, Bayes’ theorem) we can write
P(I=y|T=y)=\dfrac{P(T=y|I=y)P(I=y)}{P(T=y)}
=\dfrac{ar}{ar+(1-b)(1-r)}
=\dfrac{1}{1+\bigg(\dfrac{1-b}{a}\bigg)\bigg(\dfrac{1-r}{r}\bigg)}
2. Discussion
The first question to ask is how effectively we can estimate r. As mentioned above, for an ideal test, a = b = 1, and our equation for r reduces to r = P(T = y). Rather than use theory, it’s straightforward to use python and a random number generator to simulate how the estimate behaves as more people are tested. The graph below shows three separate results for estimating r = 0.1 when a perfect test is available.
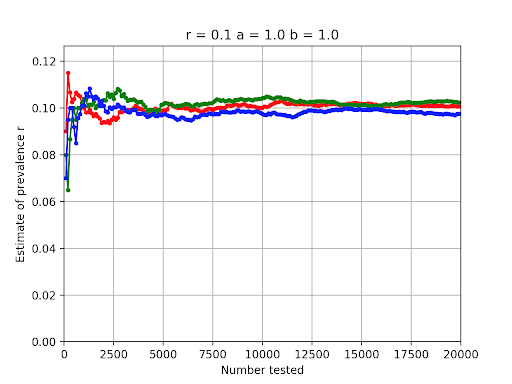
We see that in all three disease testing cases the estimate hops around but has neared the correct value of 0.1 once 2,000 or so tests have been administered.
The graph below shows three simulations for what happens if the test at hand isn’t perfect. In this case, a = b = 0.95
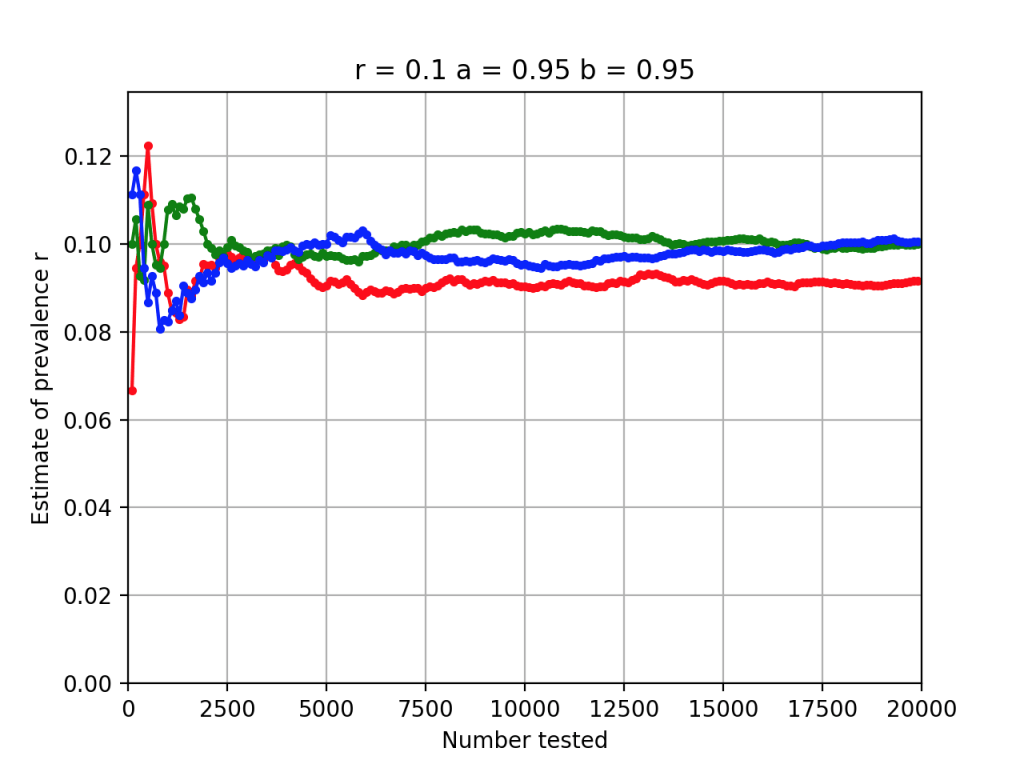
Once again, reasonable estimates of r can be obtained by testing a few thousand randomly selected subjects.
Finally, the graph below shows how P(I = y T = y) varies as a function of the disease’s prevalence when the imperfect test is employed
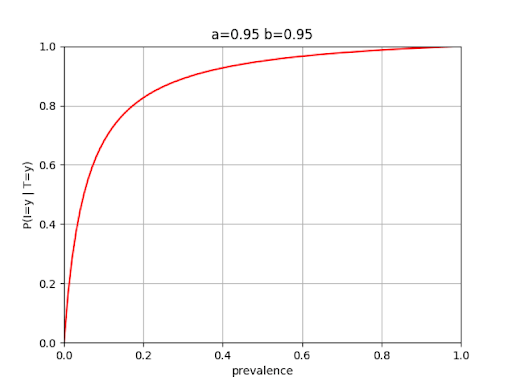
We see that at a disease prevalence of 0.1, the probability that a subject is infected given a “yes” test result is only on the order of 0.7. This is a lot less than you might have intuitively suspected given test specificities and sensitivities of 95%. Of course, a doctor may have other information at hand as well, such as symptoms the patient is reporting, which can increase confidence in the diagnosis.
The CDC is currently conducting seroprevalence testing in selected regions in the U.S. to obtain estimates of COVID-19’s prevalence. “The survey includes people who had blood specimens tested for reasons unrelated to COVID-19, such as for a routine or sick visit during which blood was collected.”
The prevalence estimates vary by population group. For example, testing conducted in New York City between March 23 and April 1 indicated a prevalence of 6.9% at that time, while testing in Connecticut between April 20 and May 3 indicated a prevalence of 4.9%. Other regions were lower, for example, testing conducted in Utah between April 20 and May 3 showed a prevalence of 2.2%.
In summary, to understand the predictive power of imperfect tests with respect to a specific individual, it is important to know the prevalence of the disease in that individual’s population group, as well as the test’s fundamental performance parameters: its specificity and sensitivity. Ideally, a single test result is only one piece of information used in reaching a conclusion with respect to that individual’s infection status.