Today, organizations across industries increasingly have their heads in the cloud. No, it’s not that they’re ignoring or unaware of the problems they’re facing — it’s that cloud technology and cloud monitoring tools are transforming how organizations store information about our everyday lives and review, observe and manage IT infrastructure.
The cloud is exploding. With public cloud spending set to reach $591 billion this year, IT decision-makers need to be thoughtful with operations and management to drive specific, desired outcomes in their digital transformation journey. But as more users leverage the power of the cloud, data centers are growing, creating more complicated and diverse metrics and monitoring challenges than ever before.
One such challenge is the cloud overpromising and underdelivering in terms of lowering costs. It’s entirely too easy to burn cloud resources and not realize they’re being wasted. Cloud metrics and monitoring tools can help provide insight to combat this and other cloud computing challenges.
As the world of business moves to an increasingly digital space, more tools and options are available to facilitate cloud observability and alerts than ever. This blog series aims to summarize the capabilities and data flows of three common off-the-shelf cloud metrics and cloud monitoring tools, driving a better understanding of the best way to implement raw data from an app’s services into meaningful dashboards and alerts. Empowered with that knowledge, readers can identify when service-level objectives that negatively impact the user experience are not being met.
Contents
Understanding Cloud Monitoring Tool Options and Value
In this first post in the series, we’ll dive into cloud application observability, some common definitions, how it generally works, implementation and best practices before comparing different vendor tools.
What is Cloud Observability?
For organizations seeking to speed problem identification and resolution, cloud observability empowers a deep understanding of the systems and services in operation. With cloud applications, observability involves aggregating, correlating and analyzing performance data from a distributed application and the hardware and general services on which it runs. Leveraging software tools and practices to better monitor, troubleshoot and debug the application enables organizations to meet customer experience expectations, service level agreements and other business requirements. The same data can also expose overspending on resources and feed automated optimization efforts via frameworks like Kubernetes.
As IT teams continue adopting modern development practices like DevOps, data analytics and cloud-native technologies to bring more services to market faster than ever, traditional approaches to application performance monitoring cannot sample data fast enough to record every application user request or transaction in a high-fidelity, context-rich, fully correlated manner. Cloud application observability is essential for any organization that needs to know what is happening with its application in the cloud.
Cloud Observability Definitions and Terms
App vs. Resource Monitoring
The consequential first step is understanding the difference between app monitoring and resource monitoring.
- Application monitoring is a collection of metrics and monitoring processes related to our specific application services’ performance, availability and user experience.
- Resource monitoring focuses on assessing the health, capacity and performance of off-the-shelf services we use as part of our application. Examples of the latter include databases and queues such as SQS or Kafka, Kubernetes, EC2, etc.
This distinction is important because one consideration we want to keep in mind is what kind of out-of-the-box integrations are available with our toolchain so we don’t have to implement our own integration. As engineers, our time is better spent focused on application monitoring specific to us. For this blog post, let’s assume the platforms in question are fully integrated with the resources we use. Therefore, we do not need to go into additional detail here.
Key Performance Indicators
Throughout this article, we will refer to key performance indicators (KPIs). KPIs and metrics are often used interchangeably, which can be confusing. Metrics are the raw data provided by services. Effectively samples over time of service performance, metrics do not necessarily reflect the business performance — revenue per hour, for example — of services. KPIs are business-facing data points that indicate how well an application achieves its business goals. KPIs may ultimately map to a single metric, but more often than not, a KPI aggregates one or more metrics. The implication here is that metrics serve multiple parties and purposes — from production health monitoring to developer troubleshooting to QA validation to business performance.
Tags
Finally, we will also talk about tags in this series of posts. Tags allow users to filter, group, search and analyze data across the most complex environments by adding context in the form of key/value pairs. With tags, users can discover, dynamically organize and quickly analyze data across the entire observable stack to troubleshoot the root cause of problems.
Logs vs. Metrics vs. Traces
Logs, metrics and traces are the fundamental data types that feed into the monitoring stack from our services.
- Logs are just that — an append-only sequence of records written to one or more destinations, such as file, database and, of course, stdout. as you’d expect of any service. Logs include log levels (DEBUG, INFO, etc.), timestamps, maybe function and line number, a developer-defined message and other fields according to your logging package. Sometimes these fields are aggregated onto a single line of text, but other implementations may produce JSON records or other formats. Many packages provide multiple options.
- Metrics are very specialized data points supported by a monitoring platform. There are several metrics in the cloud monitoring tools we will evaluate. Metrics are usually helpfully named to identify their purpose and have key-value tags to allow filtering. For example, we could expose a metric named orders.processed with a label called type with possible values of market, limit and stop. These metrics would tell us the total number of orders placed and filter to just total market orders. You can think of a metric as representing a variable in code, where the variable is one of a set of defined and supported types with a little tag metadata.
- Traces are designed to trace calls through the system across multiple services. A trace includes context about an entire action in the system, pulling together logs, metrics and other data into an end-to-end timeline. Traces are valuable when assessing how multiple services interact to determine where and why a failure may have occurred. We’re not going to focus on traces in this series. Traces, while important, are used more for debugging than monitoring. We’ll mention them occasionally but largely ignore traces for this series.
Common Standards for Cloud-Native Apps
For cloud observability, OpenMetrics and OpenTelemetry are popular standards. While both projects aim to simplify how cloud services are monitored and data is collected in a cloud-native distributed application environment, we’ll focus on OpenMetrics in this blog post. The reason for this is simply maturity. OpenTelemetry is relatively new, more complicated to set up and is still undergoing interesting levels of change in the specification. OpenTelemetry also specifies an OpenMetrics collector, allowing OpenMetrics to coexist with OpenTelemetry so we’re not boxed in later.
OpenMetrics, according to the project’s website, “specifies the de-facto standard for transmitting cloud-native metrics at scale, with support for both text representation and Protocol Buffers.” By supporting both pull- and push-based data collection, OpenMetrics improves Prometheus’ cloud-native observability with new features like:
- Units as new metadata.
- _created events for the creation and resetting of metrics.
- Exemplars that allow information about traces to logs and metrics.
- New time format.
Understanding cloud app observability and common standards for cloud-native development, let’s now look at the basic cloud monitoring stack and some common metrics.
The Basic Cloud Monitoring Stack
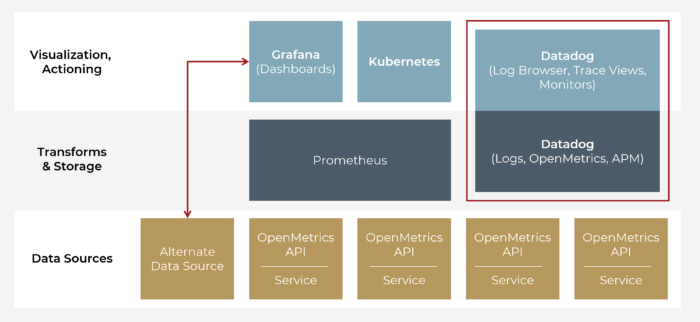
A basic monitoring stack is shown in the figure below. We can design our metrics bottom up (focusing on just the service and what it does) or top down (beginning with KPIs). Often, it’s a bit of both.
The goal is to gather application data metrics from service instances, optionally transform that data and then store it in a database. Typically, such databases are purpose-built time series databases. The database provides a query language that may include metric-specific data transform functions as part of its syntax, such as differentials, sums and averages with time window parameters to define a rolling window.
Once the app data is collected, the resulting output makes its way to a visual dashboard like Grafana or CloudWatch. The data may also be acted upon for other purposes. Kubernetes is a classic example. Kubernetes can use metrics data to automatically scale up and scale in resources to keep an application’s performance up in response and meet load, which also optimizes cost by keeping resource utilization high. Another classic example is a rules engine to monitor metrics data and generate alerts for dashboards or PagerDuty.
Basic Cloud Monitoring Stack
With a quick explanation of the basic cloud observability stack, let’s dive into some of the most common cloud metrics before highlighting different cloud monitoring tools in the next part of this blog series.
Cloud Monitoring Metrics
Many popular cloud monitoring tools support the same types of cloud metrics. The most common types of cloud metrics are captured here, with platform-specific metrics covered in the appropriate section.
Most Common Types of Cloud Metrics
| Metric | Description |
|---|---|
| Counters | Counters are monotonically increasing values. Counters simply count — or determine the total number of — occurrences of things like orders made or records processed. |
| Gauges | Gauges are like counters but can increase or decrease, whereas a counter can only increase. Gauges help track things that vary over time, such as ad load, queue depth, etc. Gauges can also be handy to signal event alerts, such as the execution of a cron job or loss of communication to a critical resource. |
| Histogram | A histogram is a more complex (and therefore easy to misuse) construct that allows one to “bucket-ize” observations. For example, some cloud monitoring tools can more efficiently manage the collection of response times, response sizes or quantile counts using a histogram instead of a counter. Even better, these tools provide basic statistics and analysis functionality that is easy to use and generally more performant than cobbling together metrics from counters, etc. That said, histograms are — again — difficult to use correctly and must be carefully considered. |
| Metric Units | Metrics typically have units associated with them to describe the data. Specific units vary a bit by platform, but they generally are things you’d expect: bits, bytes, etc. |
This robust 101 section threw a lot at you, but the following section will hopefully tie it all together before you decide which tool is right for your application.
Cloud Observability Implementation and Best Practices
As is often the case, there are trade-offs between which mechanisms we use for data collection.
Logs are easy and don’t require special knowledge or attachment to the monitoring platform. However, they are also fragile: Developers may not understand the monitoring tooling attached to a log and inadvertently break alerts or other things that depend on a log record. Generally speaking, logs are best used for deep developer troubleshooting and, at most, for creating alerts based on stable log record field, such as the log level vs. the actual copy of the log message. Logs can also be insanely high volume if operating a large number of chatty service instances, resulting in high cost and performance penalties across the board.
Metrics, on the other hand, require premeditated thought and care during implementation. They provide detailed and accurate information, and their purpose is evident in the code, helping avoid breakage. They may also offer application-specific labels, aiding consistency across services when correlating or aggregating related metrics for a particular cross-service feature. If cloud metrics are implemented poorly, service performance may suffer or costs may increase. Yielding the desired KPI result occasionally requires complex and unobvious decision-making about where metrics should be transformed and analyzed. Metrics are generally smaller in overall volume due to their specific nature and, therefore, easier and cheaper to manage within a monitoring platform.
When should you implement metrics? Speaking from experience, it is a tedious and painful process to retrofit an application with metrics after it’s been deployed. Most developers find this about as exciting as full-time bug fixing. As a best practice, any new feature being added to the application should include a list of metrics required to monitor that feature’s performance and KPI value. Adding the metrics you think you will need at the time of implementation is far easier when everything is fresh in your mind.
I also recommend a short post-mortem review of any production outage or issue to understand what happened and why. Often, metrics can be identified as part of this exercise that would be useful to simplify troubleshooting or — even better — proactively alert on the specific issue. It may also be possible to identify a pattern of existing metrics that allow the configuration of an alert to notify the support team of an impending issue before it happens.
Another thing to pay careful attention to is the use of tags. In most dashboarding tools, tags may be used to filter metrics down to smaller, more detailed views. Our example earlier for orders.processed may be interesting, but splitting this metric into limit and stop orders may grant better business insight or help identify problems specific to the type of order being placed. What you want to avoid is using unique tag values. For instance, logging a metric with a user ID would mean that your dashboard would have a unique metrics set for each unique user. Putting the user burden of trying to manage that in a dashboard aside, you are also using a lot of resources to track the metrics for each unique user. In this case, a log may be more effective, or you may get the insight you need by counting user roles instead of their unique ID.
Regarding tags, a common question is about unique service instances. Most metrics systems will add an instance ID tag to metrics (e.g., IP address or GUID). A common challenge is, “if I’m collecting counters on all these instances and the instance restarts, do I need to remember where I left off?” A similar question is, “how do I know the total count?” Each instance is ideally unaware of the others and only knows its own count. The metrics database typically provides functions and query options to aggregate data across all instances to speak at a service level — taking into account a reset to 0 on instances.
Conclusions on Cloud App Observability
So, logs and metrics, which approach is better? Using the right tools for the right job, of course! Logs are more useful for deep-level troubleshooting and ad hoc alerting, such as during production troubleshooting. Logging’s less-structured format offers fragility that should be avoided in a hardened monitoring solution with expected and relied-upon KPIs. Metrics are also more performant and cost-effective in the long run. The extra development effort required by metrics is quickly recouped in the form of better data quality, with lower data volume and less fragility.
Tag names are a way to describe a top-level metric. Names can also be shared across services to provide visibility on common use when cross-service troubleshooting. To avoid large resource use, tags should be provided to subdivide or filter down a metric, making sure tags are not unique or at least constrained to a small set.
Clearly, cloud observability can be quite complicated. Whether gathering logs or metrics, observability provides contextual information empowering IT teams with actionable insights. In the next post in this blog series, we dive into a vendor comparison so that you can determine the right cloud monitoring tool for your project.
Are you interested in learning how Cardinal Peak’s cloud experts can help your organization with cloud application monitoring? Reach out today.